
Adaptive Discovery: Data Visualization and Visual Analytics Software
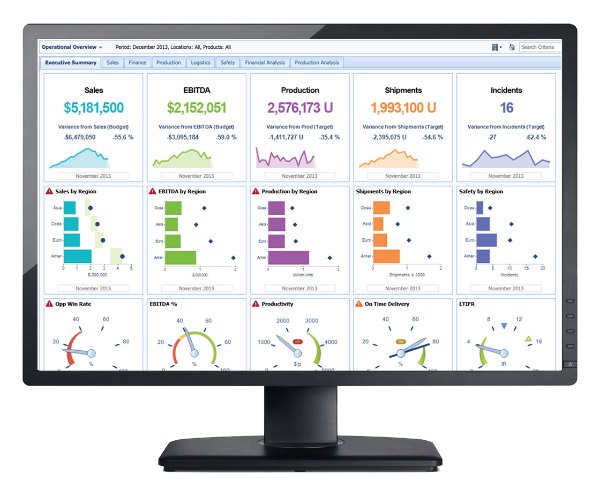
Adaptive Discovery delivers cloud-based visual analytics to help your company drive faster and better decisions. This data visualization and visual analytics software is not intended to be used purely by IT, but rather it is designed for use by executives, finance, and line-of-business managers as well. Visualize data and key performance indicators (KPIs) through interactive and intuitive charts and analytics. Adaptive Discovery makes “do-it-yourself” analytics a reality by enabling business users to understand performance, pinpoint the root cause of problems and determine the best corrective action.
This tool provides unparalleled capability to drill down into data, ad hoc and conduct what-if scenarios with absolutely no programming expertise. With Adaptive Discovery you can even create automated alerts and triggers based on specific data behavior. This visual analytics software was created with the end user in mind to alleviate your spreadsheet woes and take your company to the next level with business intelligence software made for business users.
Dashboard Software & Data Visualization
- Collaborate with sophisticated analytics and intuitive charts
- Integrate dynamically with any data source
- Access essential data dashboards and visualize KPIs
- Data visualization enables users to make faster decisions
- Minimal training needed to deploy dashboard software
Navigate Scorecards & Dashboards
- Dashboards and scorecards modified for each user
- Effortlessly adjust time periods and filter by dimensions
- Maneuver through the application quickly and intuitively
- Tailor views so that users see data that’s significant to them
- Get to where you want to go quickly across different levels of data
Interactive KPIs & Visual Analytics
- Malleable options for drilling down and across data on dashboards
- Easily interchanging dimensions mid-drill
- Comprehend root causes and perform what-if scenarios
- Business intelligence application to forecast targets for KPIs
Data Visualization Application
- Easy-to-use visual analytics that require no programming
- Aids users in better understanding their business
- Data storytelling used to explain what’s happening in your business
- Quickly justify performance and expose complications
- Various ways to observe data to analyze different circumstances
Information Sharing, Alerting, & Collaborating
- Use the shared notes feature to attach explanations to data
- Use zones and alerts to call users’ attention to issues
- Prompt emails with indicated data behavior
- Offer information about specific charts to assist in guiding users
- Aid decision-making by uploading training and reference materials
Visual Designer for your Personal Dashboards
- Make it simple for users to personalize their own dashboards
- Create and edit charts and dashboards by using drag-and-drop
- Leverage pre-defined chart formats or create your own
- Create private dashboards or share them with others
- Deliver self-service customization without relying on IT
Business Intelligence Software and the Architectural Advantage
- Dashboard software with high-performance analytic engine
- Infinite scaling capability, fast performance and flexibility of enterprise business intelligence software
- No cubes vital to this business intelligence software
- Cube-like data store automatically configured as data is loaded
If you are interested in learning more about Adaptive Discovery click here to contact InnoVergent. We would be more than happy to answer any questions you may have, send you additional information, or even schedule a Free Adaptive Discovery Demonstration.